The navigator on the left side of the screen allows you to select functions to study data over time. Click on a icon and learn more about the distribution, profile, peak performance, power profile, critical power, speed, heart rate/power relationship, body metrics and the metabolic cost.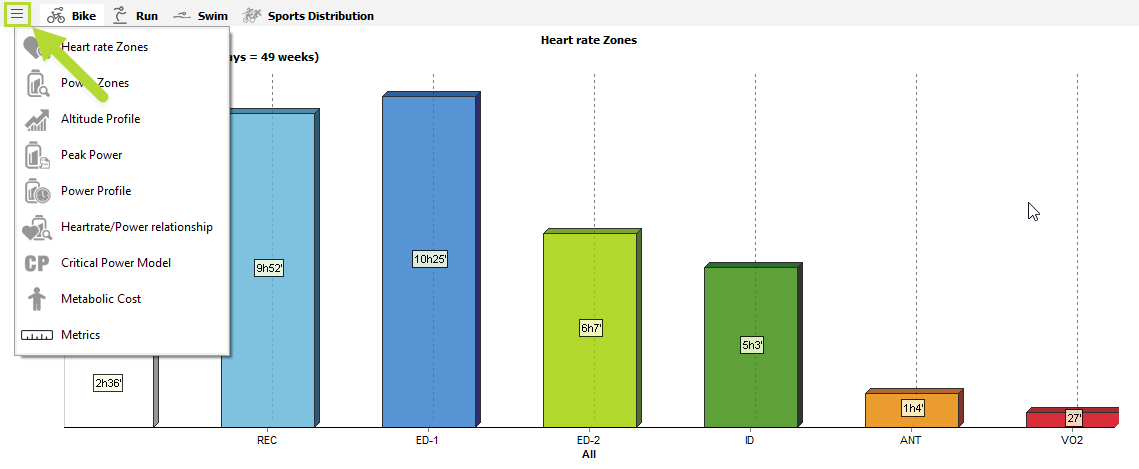
 |
Heart rate zones | Volume% analysis by heart rate zones. |
 |
Power zones | Volume% analysis by power zones. |
 |
Speed zones | Volume% analysis by speed zones. |
 |
Profile | Gradient range analytics & climbing capacity. |
 |
Peak power |
Peak performance analysis (bike). |
 |
Power profile |
Power profile in relation to other cyclists. |
 |
Peak speed |
Peak performance analysis (run). |
 |
Heartrate/Power relationship |
Heart rate / Power analysis over time. |
 |
Heartrate/Speed relationship |
Heart rate / Speed analysis over time. |
 |
Critical power |
Critical power and anaerobic capacity analysis. |
 |
Metabolic cost |
Training load analysis over time. |
 |
Body metrics |
Body metrics analysis over time. |
Comments